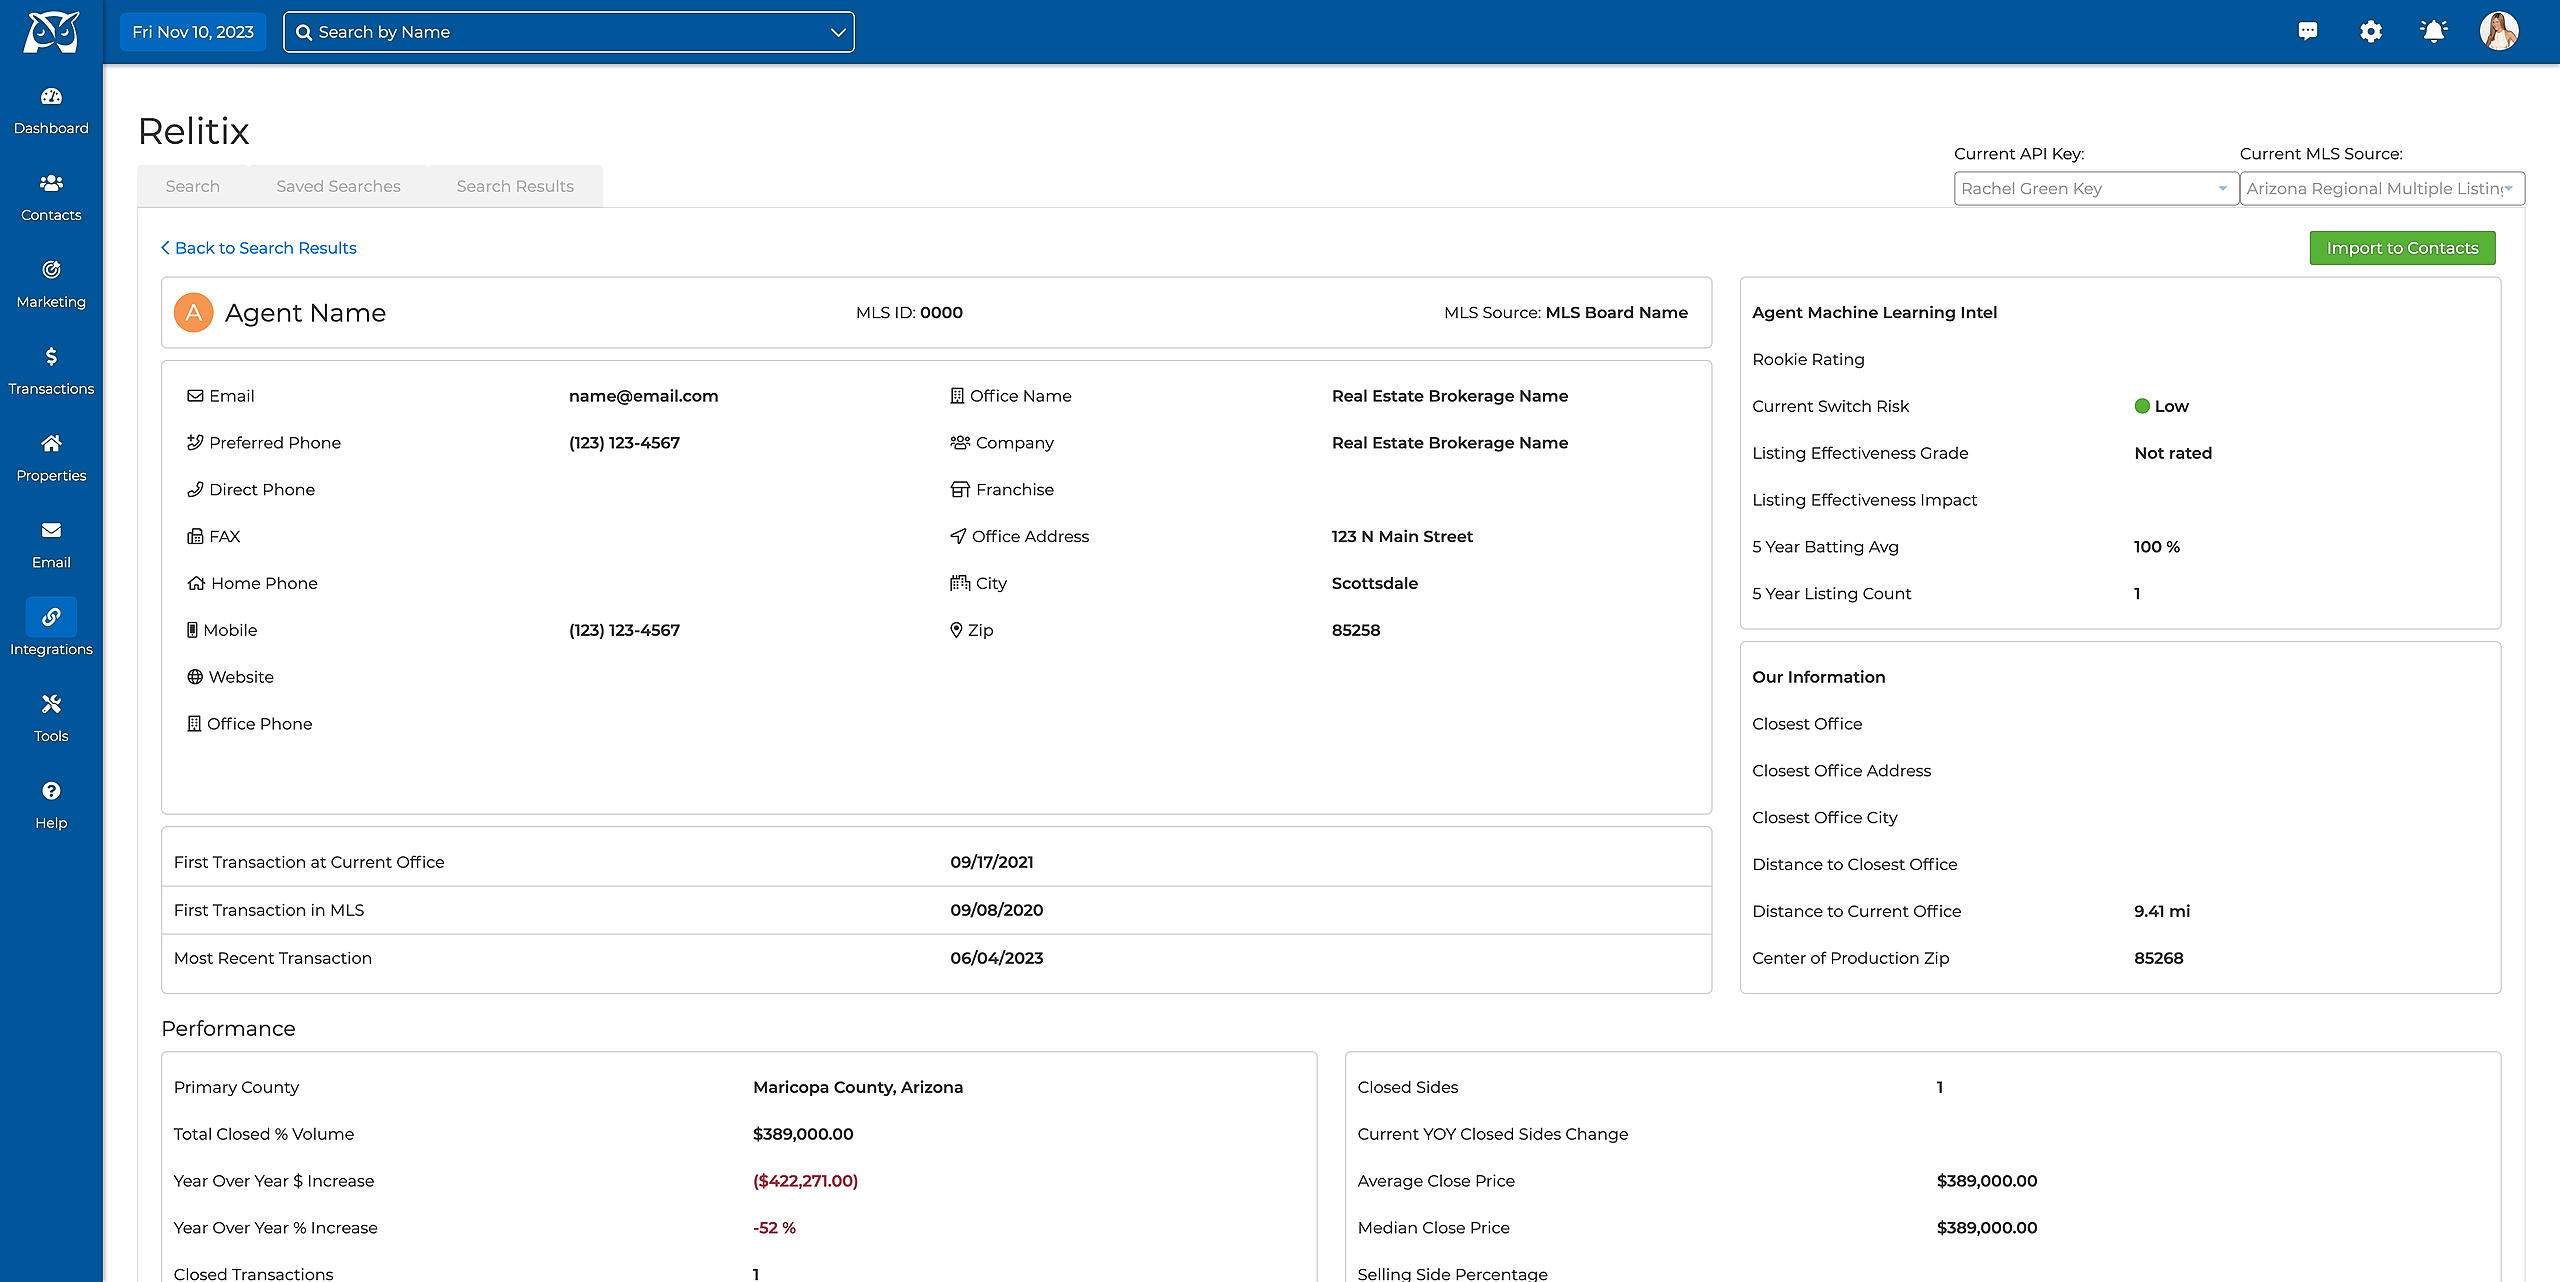
Get a 360-degree view of your agents with comprehensive analytics sourced directly from Relitix. Access switch risk, rookie ratings, and other vital metrics within the familiar interface of Wise Agent. Here's a list of all the terms you will need to know and understand.
Contact Summary Page Definitions:
- Last Updated: The date when the information was last updated.
- MLS ID: The Agent’s MLS (Multiple Listing Service) Identification Number.
- MLS Source: The MLS source that was used to import the agent's information.
- Current Office: The name of the agent's current office.
- First Transaction in MLS Date: The date of the agent's first transaction in the MLS.
- First Transaction at Current Office Date: The date of the agent's first transaction at the current office.
- Most Recent Transaction Date: The date of the agent's most recent transaction.
(Last Twelve Months) LTM Performance Definitions:
- Total Closed $ Volume: The total dollar amount of sales closed by the agent in the last 12 months.
- YOY $ Increase: The increase in the dollar amount of sales over the last 12 months compared to the previous year.
- YOY % Increase: The percentage increase in sales over the last 12 months compared to the previous year.
- Closed Transaction: The number of transactions closed by the agent in the last 12 months.
- Current # of Listings: The number of listings currently held by the agent on the MLS.
- New Listings (Prev 12 Months): The number of new listings acquired by the agent in the previous 12 months.
- Rookie Rating: This rating indicates the probability that the agent will still be in the real estate business in their fourth year and that they'll close more than $3 million in volume.
- Current Switch Risk: This risk assessment indicates the likelihood of the agent switching brokerages based on color coding: Green (unlikely to switch), Yellow (5x more likely to switch), Red (10x more likely to switch) within the next 3 months.
- Listing Grade: Agents in the MLS are graded on a curve. The top 20% receive an "A," while the bottom receive an "F."
- Closed Sides: The total number of transactions the agent has been involved in, both on the listing and buyer sides.
- Average Closed Price: The average price of closed transactions.
- Median Closed Price: The median price of closed transactions.
- Listing Impact: The difference in dollar amount closed on the agent's listings compared to the average agent with similar listings. It can be more or less than the average agent.
- Selling Side Percentage: This represents the percentage of transactions closed by the agent representing the buyer as opposed to the listing agent.
- 5-year Batting Avg: The percentage of overall listings the agent has had in the last 5 years compared to the number of listings they have closed.
- 5-Year Listing Count: The number of listings the agent has had in the last 5 years.
Please contact our 24/7 support team with any additional questions.


